

- Topic
17k Popularity
211k Popularity
32k Popularity
175k Popularity
5k Popularity
- Pin
- 🎤 Cheer for Your Idol · Gate Takes You Straight to Token of Love! 🎶
Fam, head to Gate Square now and cheer for #TokenOfLove# — 20 music festival tickets are waiting for you! 🔥
HyunA / SUECO / DJ KAKA / CLICK#15 — Who are you most excited to see? Let’s cheer together!
📌 How to Join (the more ways you join, the higher your chance of winning!)
1️⃣ Interact with This Post
Like & Retweet + vote for your favorite artist
Comment: “I’m cheering for Token of Love on Gate Square!”
2️⃣ Post on Gate Square
Use hashtags: #ArtistName# + #TokenOfLove#
Post any content you like:
🎵 The song you want to he - ✈️ Gate Square | Gate Travel Sharing Event is Ongoing!
Post with #Gate Travel Sharing Ambassadors# on Square and win exclusive travel goodies! 💡
🌴 How to join:
1️⃣ Post on Square with the hashtag #Gate Travel Sharing Ambassadors#
2️⃣ You can:
Share the destination you most want to visit with Gate Travel (hidden gems or hot spots)
Tell your booking experience with Gate Travel (flights/hotels)
Drop money-saving/usage tips
Or write a light, fun Gate Travel story
📦 Prizes:
🏆 Top Ambassador (1): Gate Travel Camping Kit
🎖️ Popular Ambassadors (3): Gate Quick-Dry Travel Set
🎉 Lucky Participant - 🎉 Hey Gate Square friends! Non-stop perks and endless excitement—our hottest posting reward events are ongoing now! The more you post, the more you win. Don’t miss your exclusive goodies! 🚀
🆘 #Gate 2025 Semi-Year Community Gala# | Square Content Creator TOP 10
Only 1 day left! Your favorite creator is one vote away from TOP 10. Interact on Square to earn Votes—boost them and enter the prize draw. Prizes: iPhone 16 Pro Max, Golden Bull sculpture, Futures Vouchers!
Details 👉 https://www.gate.com/activities/community-vote
1️⃣ #Show My Alpha Points# | Share your Alpha points & gains
Post your
[Forex] Looking for the next materials, first focusing on the August 12th US CPI | This week's foreign exchange market forecast (Technical Analysis) | Moneyクリ Moneyx Securities investment information and media useful for money.
Current Fundamentals: Consolidation Continues After Material Roundup
The range and closing price for the week of August 4 (Bid rate of Manext Trader FX)
・USD/JPY: 146.616 yen - 148.088 yen 147.747 yen
• Euro/Yen: 169.817 yen ~ 172.337 yen 172.010 yen
The US Dollar/Yen was flat with a narrow trading range for the week of August 4.
The week of August 4th, following the U.S. employment statistics that were significantly revised downward and the occurrence of important events up until the week of July 28th, there were no major factors that would greatly impact the yen exchange rate. As a result, the weekly range was 1 yen and 47 sen, which is quite a narrow fluctuation for the USD/JPY.
On August 7, it was decided that Milan, the Chairman of the CEA, would fill the vacancy left by the resignation of Governor Coogler from the Federal Reserve Board until the end of January, with the appointment of the next Federal Reserve Chair to follow later. Additionally, the modification of the tariff negotiations between Japan and the United States was tentatively assured as an agreement was reached on the U.S. side early on the morning of August 8 in Tokyo. Furthermore, regarding the reduction of automobile tariffs, the U.S. side cited the example of the UK, stating that it would take effect about 50 days after the agreement, indicating that full realization of the agreement will still take some time.
On August 8, the possibility of advancing the Liberal Democratic Party's presidential election was seen as a factor contributing to the depreciation of the yen. However, there has been persistent selling on rebounds in the 147 yen range, and the week ends with a flow waiting for the next material. The next material is expected to be the U.S. CPI, but for the time being, it can be said that developments are likely to continue while watching U.S. interest rates.
Euro/US Dollar for the week of August 4: A week of adjustment following last week's decline.
Last week (the week of August 4), the Euro/USD adjusted against the significant drop from the previous week and continued a gradual upward trend until mid-week. On August 7, it reached a high of 1.16984 dollars, but there were also euro selling orders above 1.17 dollars, so it continued to fluctuate in the mid-1.16 dollar range until the weekend.
The weekly range for Euro/USD was 171 pips, which moved more than USD/JPY, but it ended with the impression of a generally sluggish week. The same goes for Euro/JPY, which has returned to the low 172 yen range due to a buyback adjustment against last week's decline.
USD/JPY Chart (Weekly), Short-term Consolidation Phase Amidst Strong USD
We will make long-term judgments based on the weekly chart, so please first take a look at the weekly chart.
[Chart 1] USD/JPY (Weekly)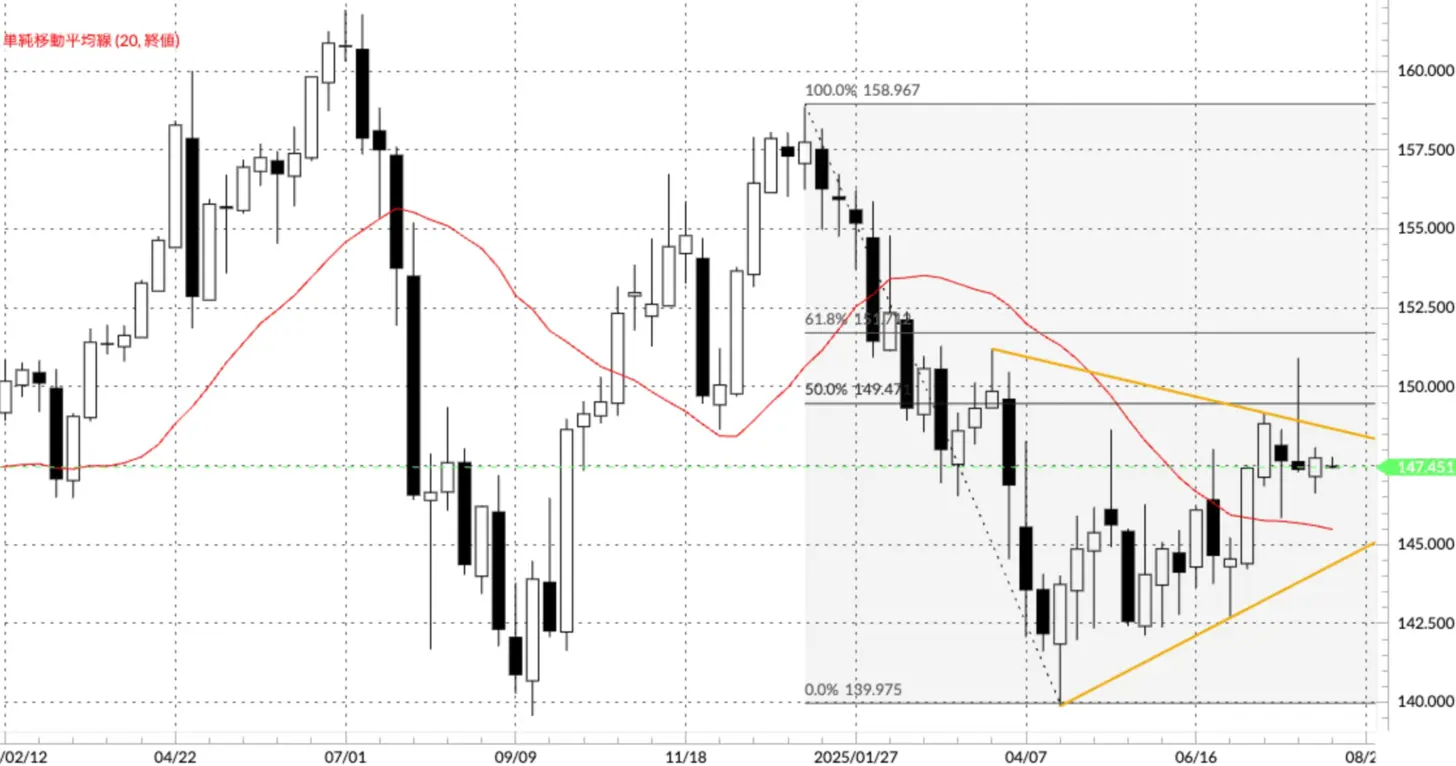 Source: Money Exchange Trader FX
[How to Read the Weekly Chart] The long-term trend is determined by the position of the 20-week moving average relative to the weekly closing price.
Source: Money Exchange Trader FX
[How to Read the Weekly Chart] The long-term trend is determined by the position of the 20-week moving average relative to the weekly closing price.
・Uptrend = Weekly closing price is above the moving average line
・Downtrend = Weekly closing price is below the moving average line
To judge a trend reversal and eliminate false signals, we look for the moving average to be exceeded or fall below for two consecutive weeks to consider the trend has reversed. In the weekly chart, the trend of a stronger US dollar remains unchanged, but during the week of July 21, it attempted to test lower levels and then retraced, while in the week of July 28, it attempted to test higher levels but faced resistance, failing to break out of the range for two consecutive weeks. Last week ended in a narrow range consolidation (see Chart 1). However, as pointed out last week, a hammer candlestick (with a long upper wick and a short body) appeared in the high price area, indicating a slightly stronger sense of caution towards the upside.
Please refer to the daily chart for the short term.
USD/JPY Chart (Daily), Dead Cross on August 1 and Golden Cross on August 8
Short-term judgments are made on a daily chart.
[Figure 2] USD/JPY (Daily)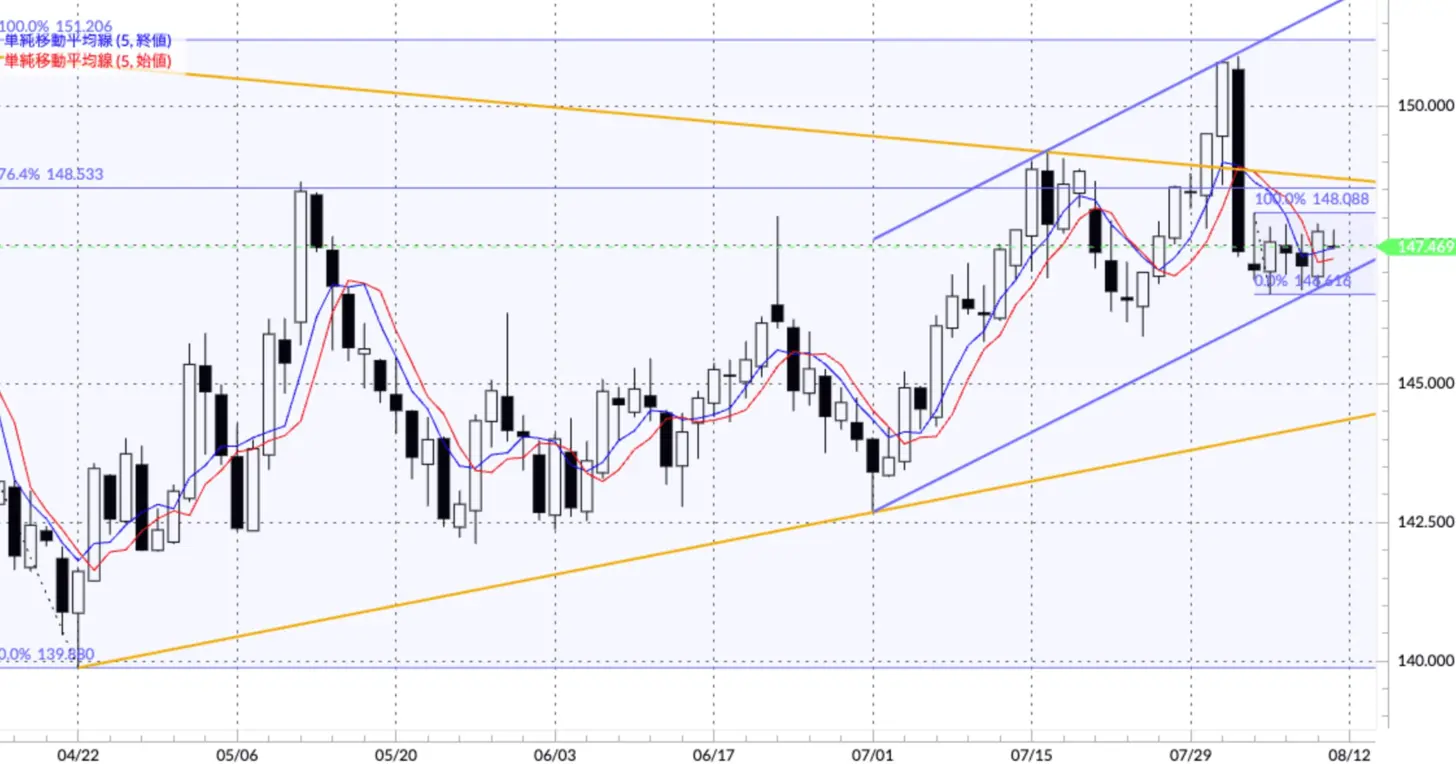 Source: Manex Trader FX
[How to Read Daily Charts] Short-term trading signals are determined by the golden cross (GC) and death cross (DC) of the 5-day closing price moving average (blue) and the 5-day opening price moving average (red).
Source: Manex Trader FX
[How to Read Daily Charts] Short-term trading signals are determined by the golden cross (GC) and death cross (DC) of the 5-day closing price moving average (blue) and the 5-day opening price moving average (red).
・Buy signal = Closing price moving average crosses above the opening price moving average from below (GC)
Euro/US Dollar continues to be in a buying trend, but the upside is also heavy.
Let's take a look at the Euro/US Dollar chart.
[Chart 3] Euro/USD (Weekly) Long-term Trend = Continued Euro Buying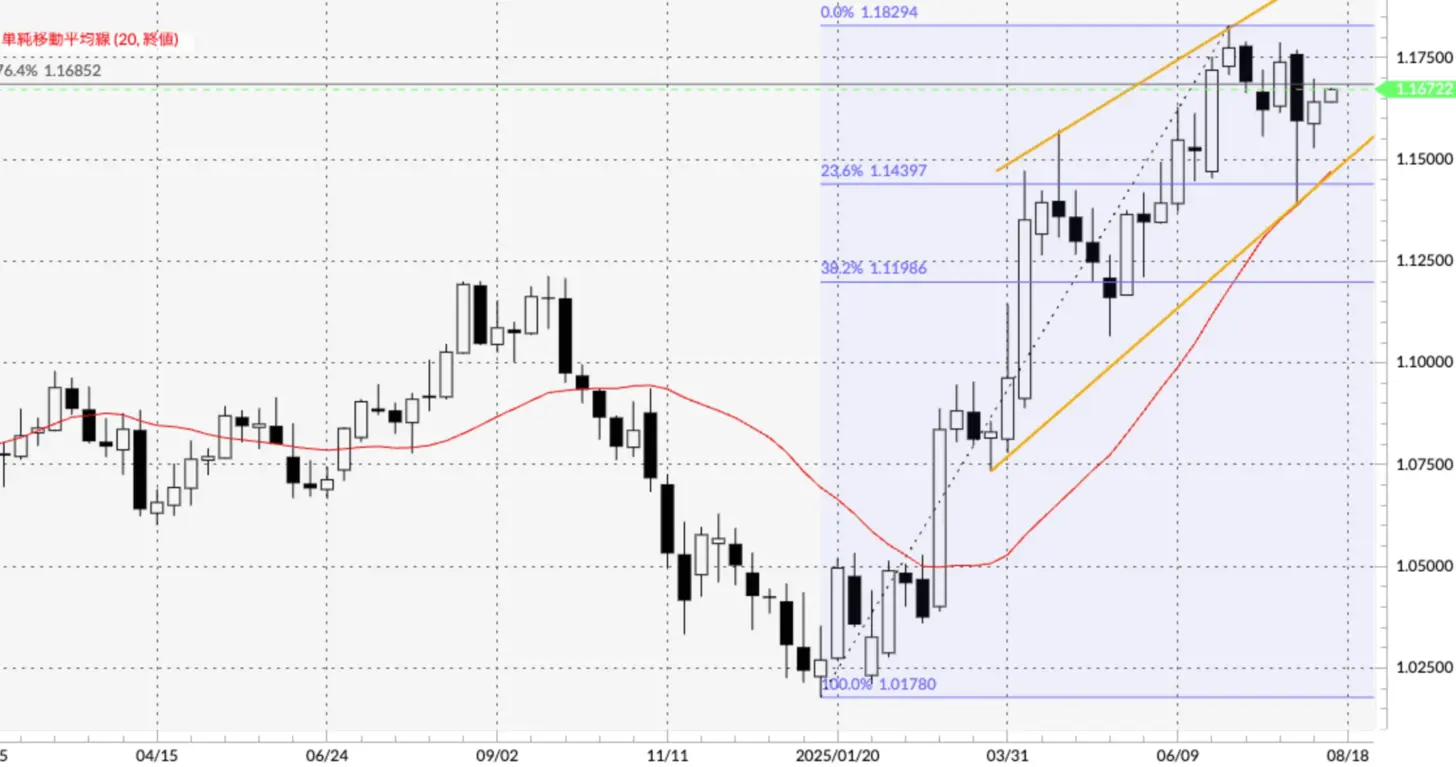 Source: Manex Trader FX
[Chart 4] Euro/US Dollar (Daily) Short-term trend = Transition to GC in 5 days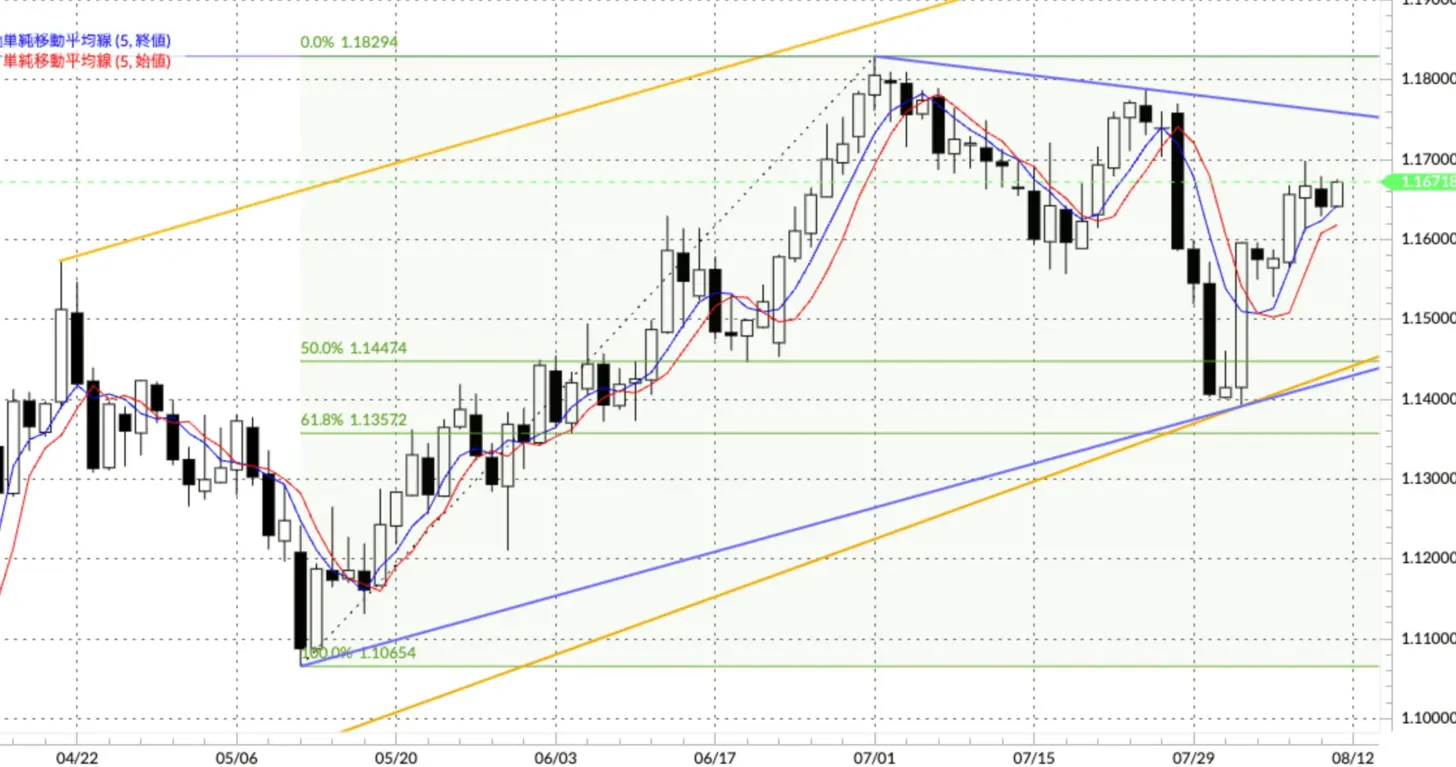 Source: Manex Trader FX
The weekly chart (Figure 3) maintains a position above the moving average and continues a gradual upward trend within the ascending wedge since March.
Source: Manex Trader FX
The weekly chart (Figure 3) maintains a position above the moving average and continues a gradual upward trend within the ascending wedge since March.
In the daily chart (Figure 4), the shift to a golden cross on August 5 indicates that the current trend is a continuation of short-term Euro buying. The selling of the Euro at $1.17 is capping the upside, but even if this level is surpassed, there is a resistance line (in blue) from the year-to-date high. This week, the Euro has been declining from the mid to early $1.17 range, so the potential for upside from here can be considered limited. When the price range is narrow, it is advisable to immediately follow the trend when a cross occurs.
The weekly chart of Euro/Yen has turned bullish after a bearish candle for the first time in 10 weeks.
Last week, it felt like the Euro/Yen was the most volatile.
[Chart 5] Euro/Yen (Weekly) Long-term Trend = Euro Buying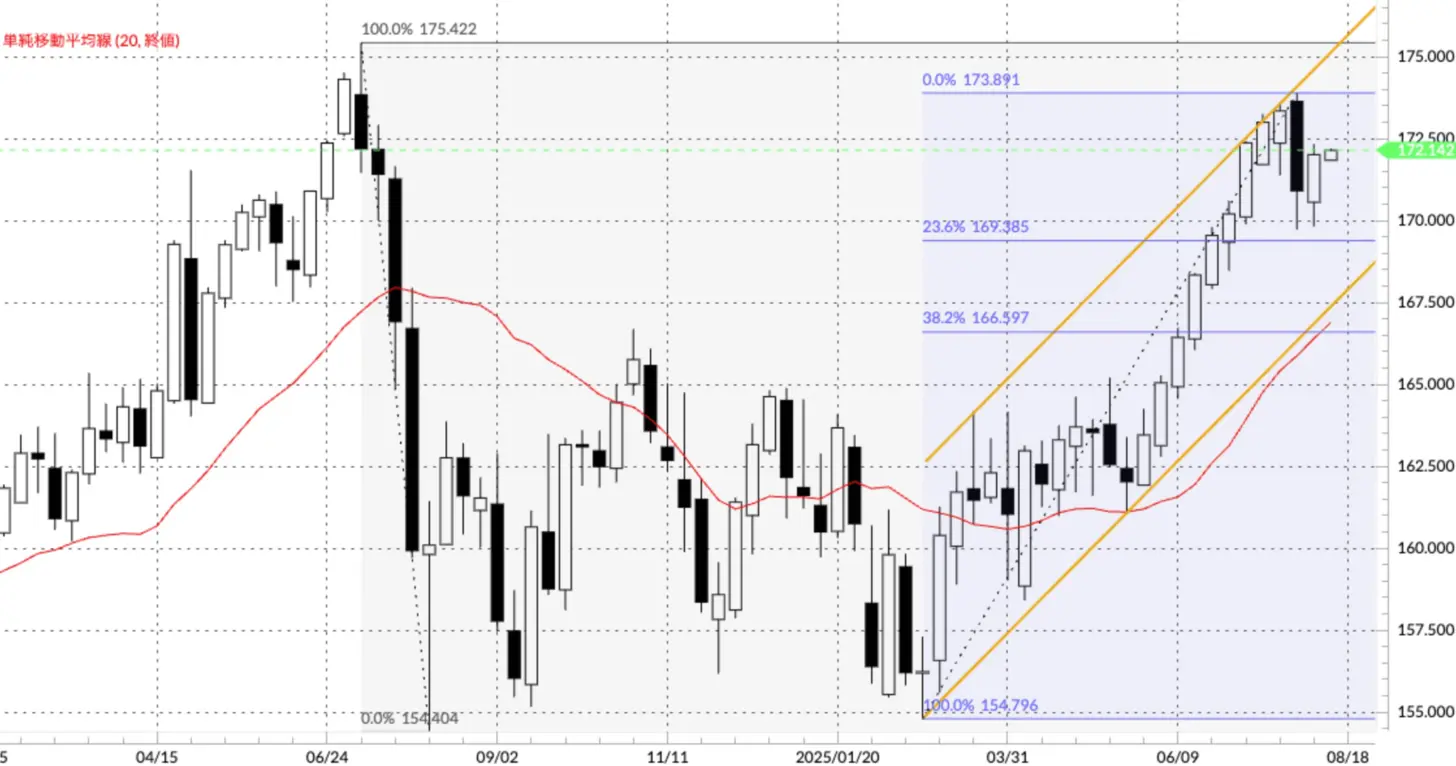 Source: Manex Trader FX
In the weekly chart for Euro/Yen, after the bearish candle on the week of July 28, buying pressure has strengthened again, and last week it returned to a bullish candle (Chart 5). The larger adjustment that occurred once has created a market condition that is more conducive to returning to the previous buying trend.
Source: Manex Trader FX
In the weekly chart for Euro/Yen, after the bearish candle on the week of July 28, buying pressure has strengthened again, and last week it returned to a bullish candle (Chart 5). The larger adjustment that occurred once has created a market condition that is more conducive to returning to the previous buying trend.
[Figure 6] Euro/Yen (Daily) Short-term Trend = Euro Buying (Golden Cross Transition on August 5)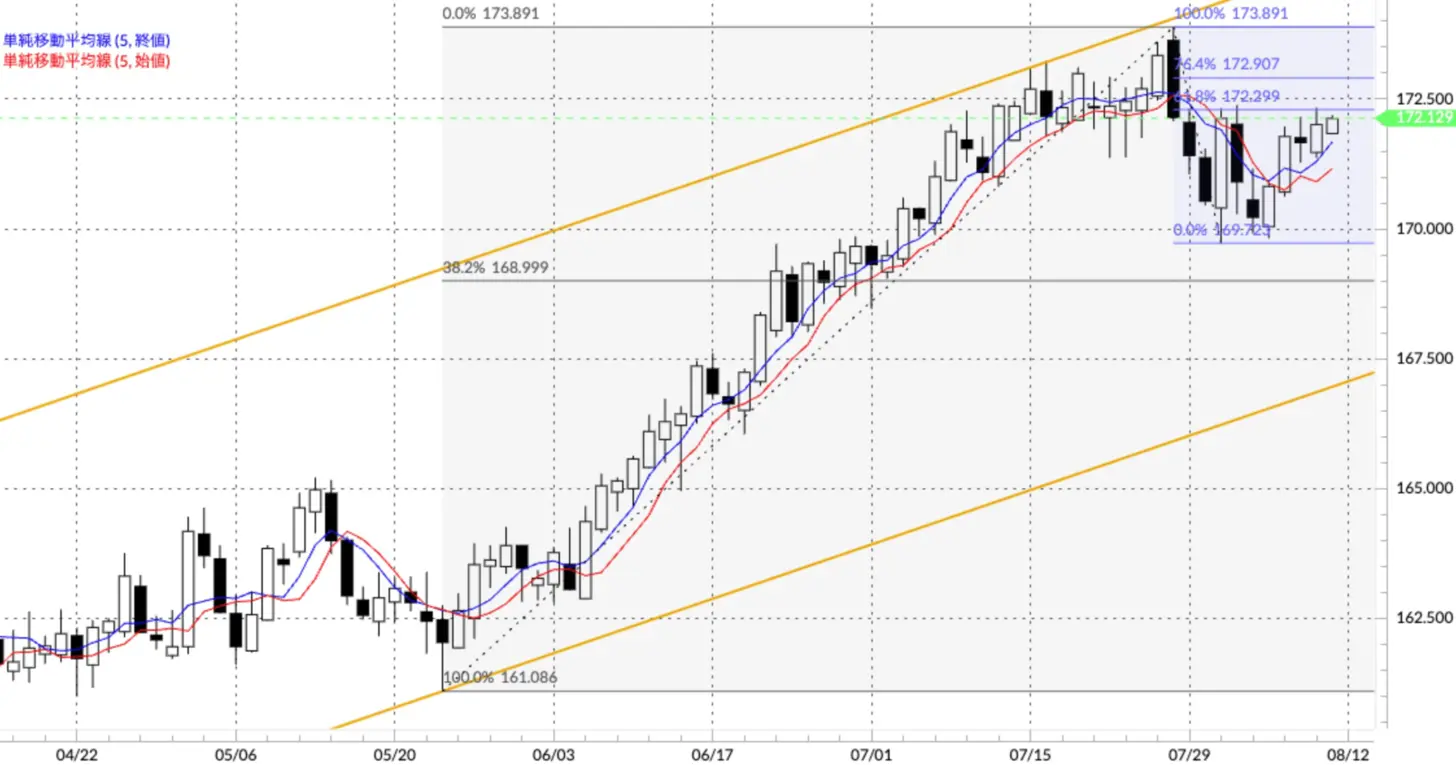 Source: Manex Trader FX
In the daily chart (Figure 6), a golden cross re-emerged on August 5, following the dead cross on July 29, indicating that the Euro/Yen has returned to a buying trend. The US Dollar/Yen is in a sideways movement, but the Euro/US Dollar continues to show a slightly firm trend, making it easier for the Euro/Yen to attract dip buying. Fibonacci retracement has been drawn between the recent highs and lows, and so far, it has been capped at the 61.8% retracement level of 172.299 yen. It is likely that it will break through this level at least once, aiming for the next target of the 76.4% retracement at 172.907 yen.
Source: Manex Trader FX
In the daily chart (Figure 6), a golden cross re-emerged on August 5, following the dead cross on July 29, indicating that the Euro/Yen has returned to a buying trend. The US Dollar/Yen is in a sideways movement, but the Euro/US Dollar continues to show a slightly firm trend, making it easier for the Euro/Yen to attract dip buying. Fibonacci retracement has been drawn between the recent highs and lows, and so far, it has been capped at the 61.8% retracement level of 172.299 yen. It is likely that it will break through this level at least once, aiming for the next target of the 76.4% retracement at 172.907 yen.
Well then, have good trades this week!